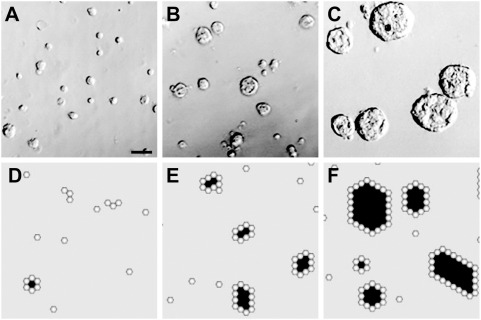
Figure 5. ALC growth in simulated and in vitro AT II cell cultures.
(A–C) Phase-contrast pictures after 4 d in 2% Matrigel. (A) Cells were plated at 1×10⁴ cells/cm2; (B) plated at 5×10⁴ cells/cm2; (C) plated at 25×104 cells/cm2. ALCs were roundish without obvious depressions or dimples. Final ALC sizes were dependent on initial cell density. Bar: ∼50 µm. (D–F) Shown are images of simulated culture, after 100 simulation cycles (∼6.1 days in vitro), starting with AT II analogues parameterized as in Table 2. Note that a hexagonal cyst within the discretized hexagonal space maps to a roundish cross-section through an ALC in vitro. Objects with white centers are cells. Gray and black spaces represent matrix and free (or luminal) space, respectively. Each simulated ALC in (D–F) maps to cross-sections through corresponding roundish ALCs in cultures. A regular, hexagonal ALC in hexagonal space maps to a circular cross-section in continuous space. The initial cell populations were (D) 200 cells (which maps to ∼1×10⁴ cells/cm2 in vitro), (E) 1,000 cells, and (F) 5,000 cells seeded randomly across the culture space. As in vitro, larger ALCs formed when the initial cell population was larger.

