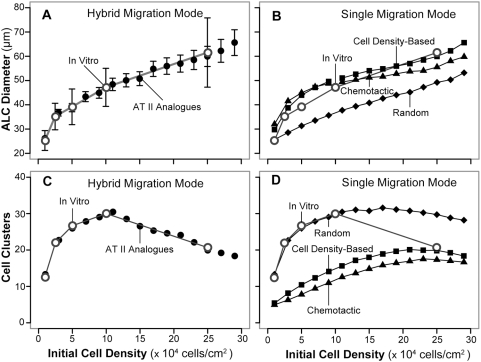
Figure 6. AT II analogues and AT II cell cultures can exhibit quantitatively similar, phenotypic attributes.
(A) Mean ALC diameters for both systems are graphed as a function of initial cell density. Open circles: mean in vitro diameter after 5.7 days; vertical bars: ±1 S.D. for 25 observations. Filled circles: mean analogue diameters after 100 simulation cycles (∼6.1 days) using the AT II analogues that achieved the most stringent Similarity Measure (SM-6); bars: ±1 S.D. for 100 simulations. The dominant migration mode used by all AT II analogues was cell density-based. At initial densities of ≤2,000 cells (maps to ≤105 cells/cm2 in vitro), 10–15% of movement events were specified randomly to be random moves rather than cell density-based. At higher initial densities, all movement events used the cell density-based mode. (B) Open circles: same as in (A). Filled symbols: mean results as in (A), except that all migration events used either cell density-based mode (squares), the chemotactic mode (triangles), or the random migration mode (diamonds). Results using the cell density-based and chemotactic modes achieved SM-5, whereas the analogue using the random migration mode failed to do so. (C) Open circles: final, mean cluster count (averaged over three culture wells) for the in vitro experiments in (A) graphed vs initial plating density. Filled circles: final mean cluster count for the AT II analogue experiments in (A). The two sets of results are experimentally indistinguishable. (D) Open circles: same as in (C). Filled symbols: mean results as in (C) except that all migration events used one of the indicated modes.

