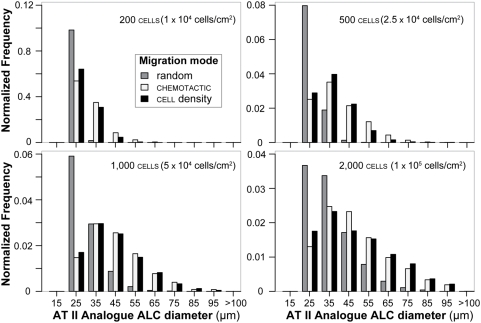
Figure 8. ALC size distributions for AT II analogues.
Analogue ALC frequencies within 5 µm intervals were measured after 100 simulation cycles (maps to ∼6.1 days in vitro) for each of the three migration modes. The frequencies were normalized to fraction of total count for each migration mode and then averaged over 100 analogue cultures. The experiments are the same as those in Fig. 6B, D. Frequency distribution characteristics depended on initial cell density and migration mode. Initial cell densities are listed along with the corresponding in vitro density to which each mapped (in parentheses). Distribution tails in the direction of larger sizes were not truncated, as appeared to be the case in Fig. 7.

