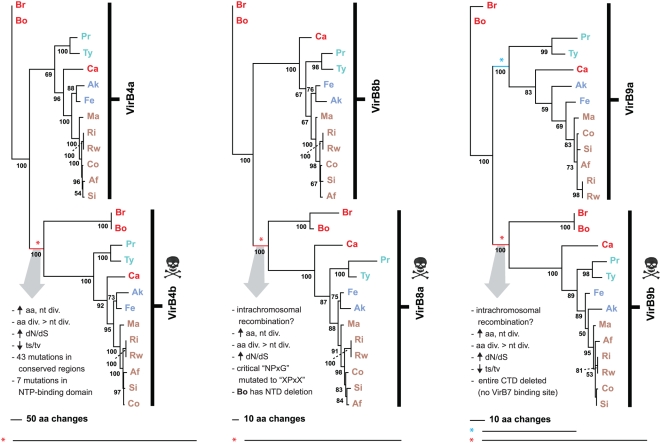
Figure 11. Phylogeny estimation of duplicate VirB4, VirB8 and VirB9 proteins.
All trees estimated under parsimony (see text for details). Branch support is from 1,000 bootstrap replications. Taxon codes and coloring scheme as described in the Figure 9 legend. Asterisks depict shortened branches that are shown in their full length below the tree. Skull and crossbones depict lineages leading to probable pseudogenization or neofunctionalization. Characteristics of these divergent sequences are listed.

