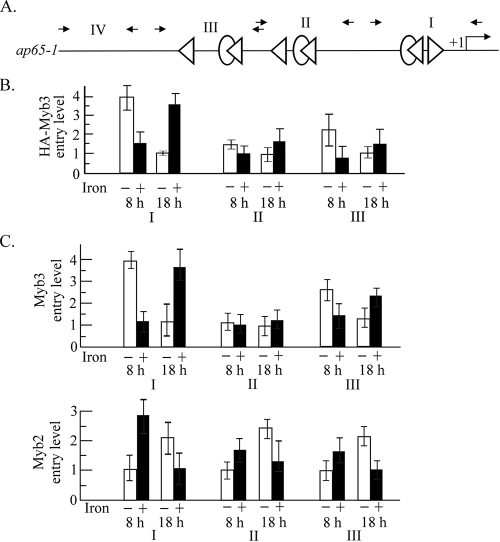
FIG. 6.
Differential promoter entries by Myb2 and Myb3 in T. vaginalis. (A) The organization of the entire ap65-1 promoter is depicted. The MRE-1-like (ovals), MRE-2r-like (left-pointing triangles), and MRE-2f-like (right-pointing triangles) elements in the ap65-1 promoter are depicted in the top panel. Small arrows indicate the primer pairs used in the qPCR to amplify regions I, II, III, and IV as defined previously (25). Samples from HA-Myb3 overexpressing cells (B) or nontransfected cells (C) under iron-depleted (open bars) and iron-replete (closed bars) conditions for 8 h (left) and 18 h (right) were evaluated by ChIP using the anti-HA (B) or anti-Myb3 and anti-Myb2 antibodies (C). Relative levels of DNA pulled down by each antibody versus input DNA were determined by qPCR. In panel B, the lowest level of HA-Myb3 promoter entry under iron depletion for 18 h was considered 1 to illustrate relative promoter entry levels under other conditions. In panel C, the lowest levels of Myb3 and Myb2 promoter entry under iron depletion for 18 and 8 h, respectively, were considered 1 to illustrate the relative promoter entry levels under other conditions. The results are the average ± the standard error from three separate experiments.

