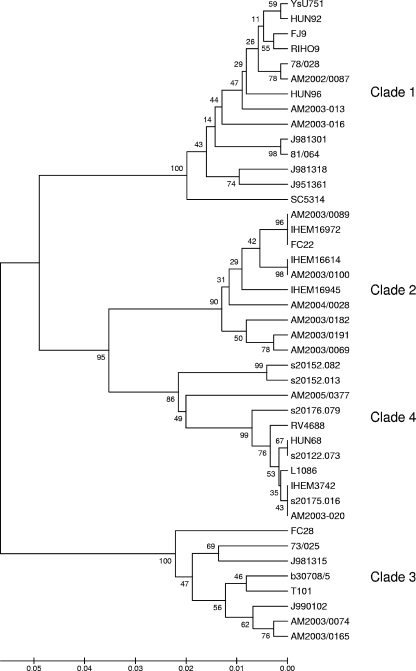
FIG. 1.
Dendrogram showing the similarity clusters (referred to as clades [shown to the right of illustration]) for the 43 C. albicans clinical isolates used in this study. The dendrogram was constructed by the unweighted-pair group method using arithmetic averages with MEGA 3.0 software as previously described (50). The numbers at nodal points indicate bootstrap values (as percentages) for 1,000 replications. The scale bar at the bottom of the figure shows nucleotide substitutions.

