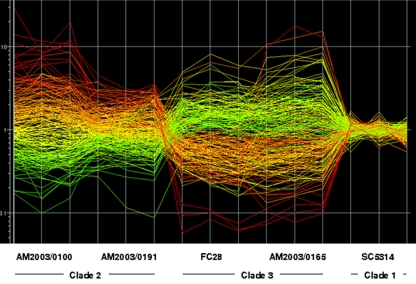
FIG. 4.
Interisolate differences in constitutive gene expression profiles. The figure depicts the GeneSpring interpretation graph for triplicate expression profiles of two C. albicans isolates each from clades 2 and 3, plus reference isolate SC5314, grown in NGY medium. Each line in the graph indicates the relative expression level for a single gene. The expression level of the gene in strain AM2003/0100 compared to SC5314 sets the color of the line, which is kept through all the other strains.

