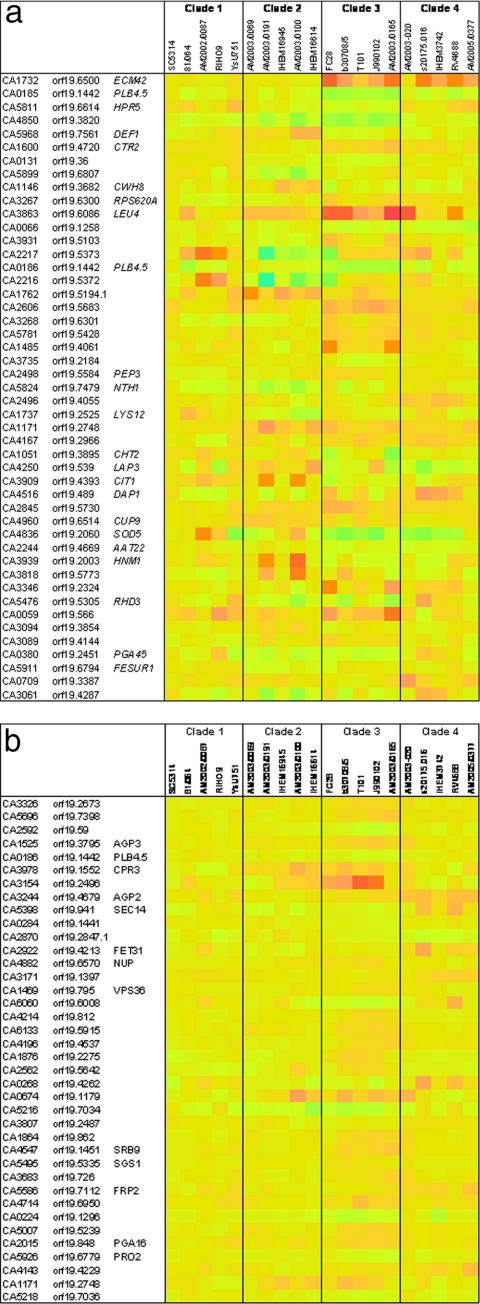
FIG. 5.
Heat maps indicating the average differences in RNA levels between genes found to be significant interclade differentiators (q < 0.05 by SAM analysis) for 20 C. albicans isolates grown in NGY medium (a) and in RPMI 1640 medium (b). The heat map colors are based on pale yellow indicating no upregulation relative to the pooled SC5314 RNA control. Colors ranging from purple (maximum of 20-fold) through red and orange indicate RNA levels greater than the level for the control, while green through pale blue (20-fold downregulation) colors indicate RNA levels below the level for the control. In both figures, the heat map for SC5314 (mean of triplicate data versus SC5314 RNA pool) is shown in the leftmost column.

