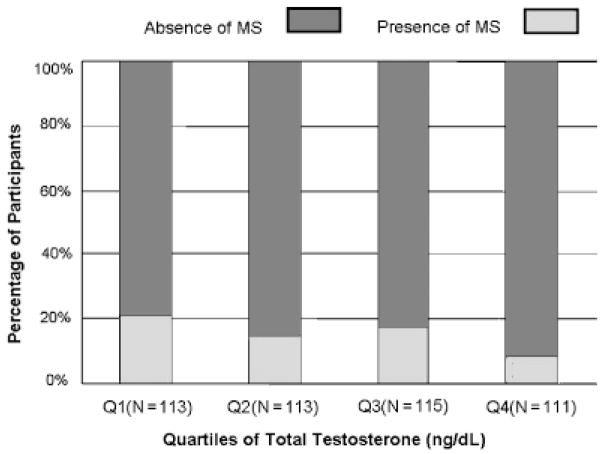
Figure 2.
Total testosterone and metabolic syndrome (MS). Percentage distribution of the participants (vertical axis) with (dark bars) and without (shaded bars) MS according to quartiles of total testosterone (horizontal axis). Numbers of participants according to quartiles of total testosterone are indicated within parentheses in the horizontal axis.

