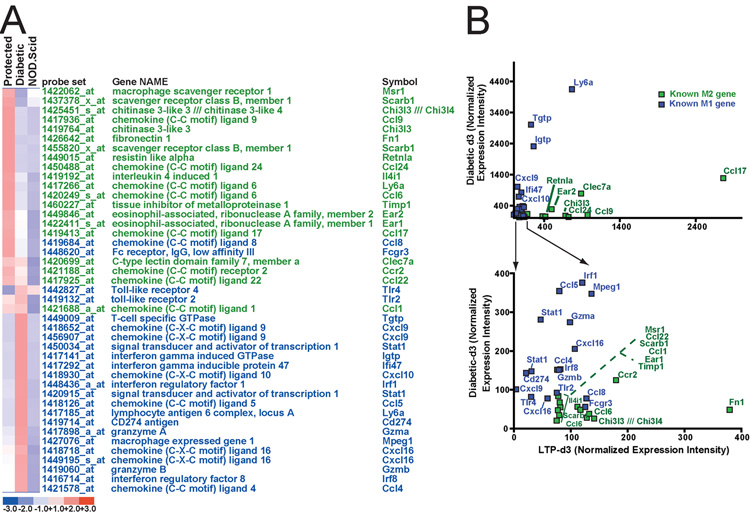
FIGURE 3.
Laser-capture microdissected LTP islets preferentially express M2 macrophage genes, whereas diabetic islets express M1 genes. GeneChip expression profiles were generated by directly comparing d3 LTP to d3 diabetic GeneChips. Those genes with profoundly differing patterns of expression (3.5-fold difference between LTP and diabetic, expressed at >75 intensity level) were identified. All genes, increased in either direction, were then classified by literature search as M1-associated or M2-associated. A, All differentially expressed M1 (blue) and M2 (green) genes from this analysis are depicted in the heat map. Note how almost all the M2 genes have higher expression in LTP and vice versa; none of the genes are expressed at the highest level in control islets. B, The same genes are plotted according to intensity levels. Genes with high expression (upper plot) and low expression (lower) are separated for clarity. Follow up experiments with additional cohorts of mice and using qRT-PCR confirms the pattern of association of M1 genes with diabetic islets and M2 with LTP.

