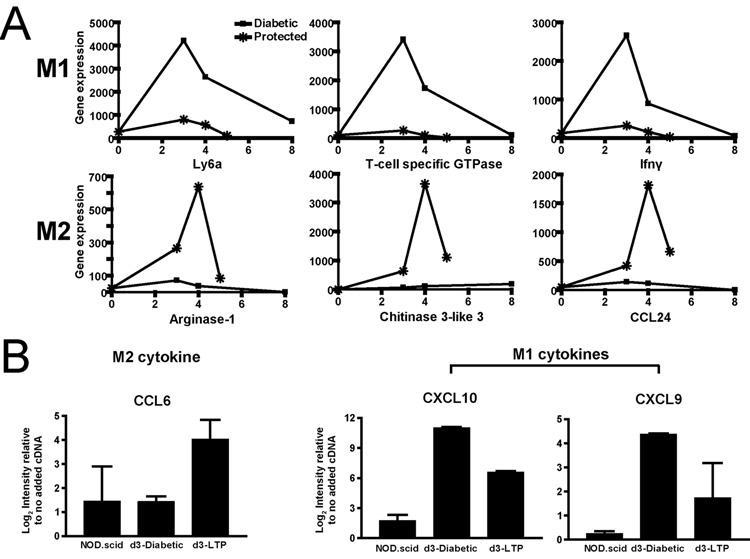
FIGURE 4.
Follow up experiments with additional cohorts of mice and using qRT-PCR confirms the pattern of association of M1 genes with diabetic islets and M2 with LTP. A, Plots of representative, selected M1 (upper) and M2 (lower) genes at later time points. B, Plots of qRT-PCR of laser-captured islets for selected M1 and M2 genes showing the same pattern of expression as on GeneChip. Results are means±SD from duplicate, independent experiments. Note that the scale is Log2.

