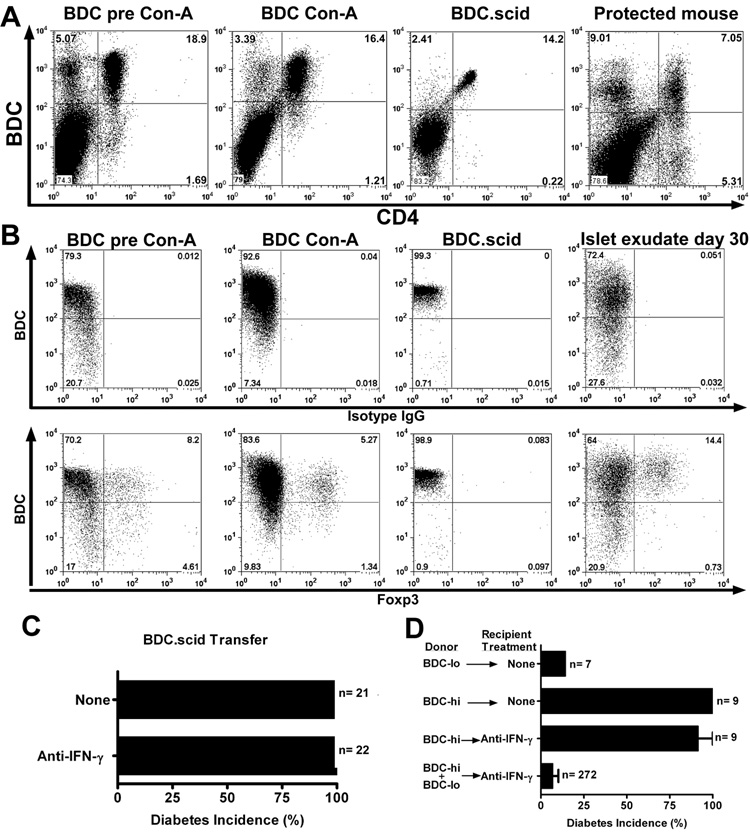
FIGURE 5.
Anti-IFN-γ treatment did not inhibit diabetes induced by the transfer of BDC-hi T cells. A, Flow cytometry analysis of spleen CD4+ T cells from BDC pre-activation, post-activation, BDC.scid and LTP mice (day 70 of protection from diabetes) and their clonotype BDC hi and -lo expression. B, Flow cytometry analysis (on gated CD4+) looking at BDC and Foxp3+ expression from splenocytes of BDC pre-activation, post-activation, BDC.scid and islet exudate (day 30) of LTP mice. Upper panels stained with BDC plus the isotype IgG control antibody. Lower panels stained with BDC plus the anti-Foxp3 mAb. C, Incidence of diabetes in mice that received BDC.scid T cells (1×10⁶) alone, or together with the H22 mAb treatment: both sets of mice developed diabetes 10 to 15 days post transfer. D, Transfer of sorted CD4+ T cells for their hi and -lo clonotype expression of BDC into NOD.scid recipients alone, or with the H22 mAb treatment and followed for 30 days for diabetes incidence. The lower bar represents the combined transfer of BDC-hi and -lo that leads to LTP from Figure 1A.

