
Figure 4. Predicted MP CpG islands are enriched in targets of Polycomb Repressive Complex 2.
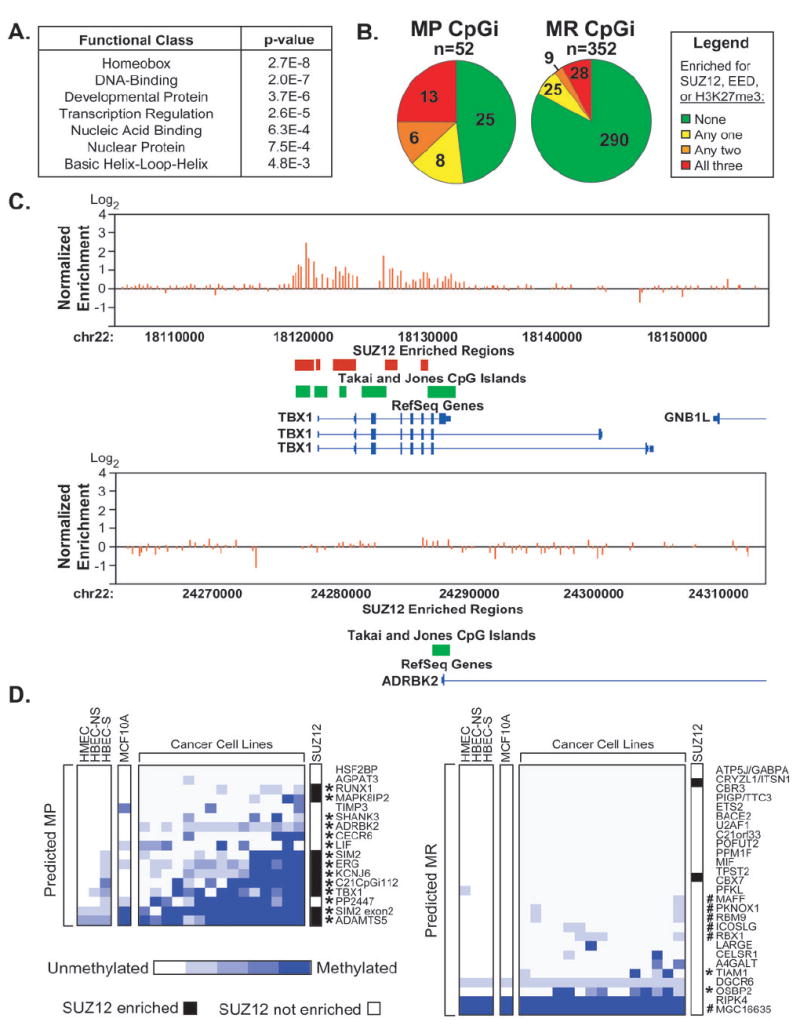
A, Annotation of gene ontology terms among MP and MR CpG islands identified by RLGS in DNMT1-overexpressing cells using the DAVID Bioinformatics Database. B, Analysis of SUZ12 binding, EED binding, or the H3K27me3 modification (9) at MP and MR CpG islands identified by RLGS in DNMT1-overexpressing cells (13). Pie charts indicate the fraction of CpG islands enriched for 0, 1, 2, or all three of these factors. C, Representative SUZ12 enriched (TBX1) and non-enriched (ADRBK2) CpG islands. Plotted are the normalized SUZ12 enrichment ratios for each probe within the window (red bars). Regions scored as SUZ12 enriched (red boxes) were compared to the genomic positions of CpG islands (green boxes), and RefSeq genes (blue). D, Methylation status of CpG islands predicted to be MP (left panel) or MR (right panel) by SUPER-PatMAn. Each MSP was performed at least three times. The degree of methylation was estimated from the relative abundance of the methylated and unmethylated products and is scored on a 5 point scale ranging from completely unmethylated (white) to completely methylated (blue). Those CpG islands scored as truly MP are indicated by asterisks (*) and were defined as described in Figure 3. #, CpG islands re-classified by SUPER-PatMAn; NS, non-smoker; S, smoker. SUZ12 occupancy status is indicated in white (negative) or black (positive).