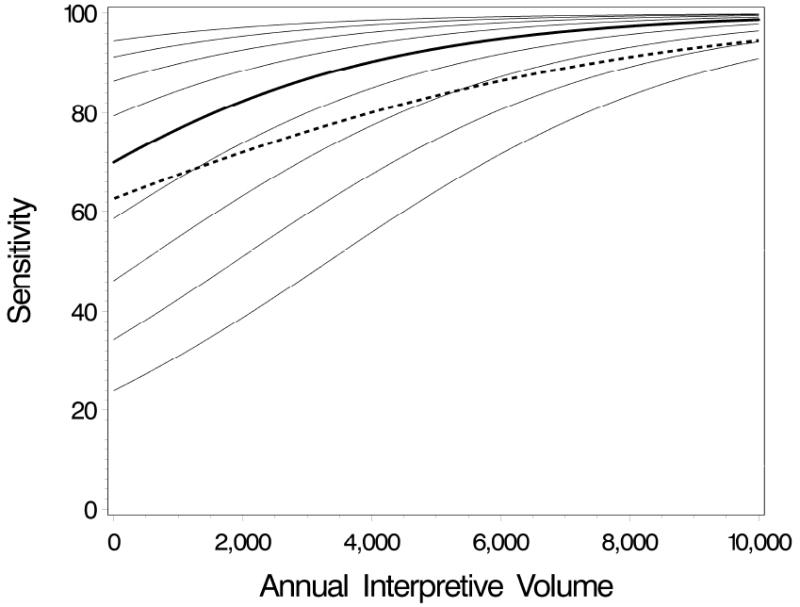
Figure 2.

Hypothetical radiologist-specific (solid lines) and population-averaged (dashed line) curves showing the effect of annual interpretive volume on sensitivity. The thick solid line is the radiologist-specific sensitivity by volume for an average radiologist, i.e., a radiologist with a random effect of zero. The thin solid lines are the radiologist-specific curves for radiologists with random effects ranging from -1 to 1 standard deviation at increments of 0.25.
The dashed line is the population-averaged (marginal) sensitivity by volume, which represents an averaging of the radiologist-specific curves over the random effect distribution. The odds ratio measuring the effect of increasing volume by 2000 on the odds of an abnormal mammogram among women with breast cancer is 2.0 for the conditional model and 1.5 for the marginal model.
