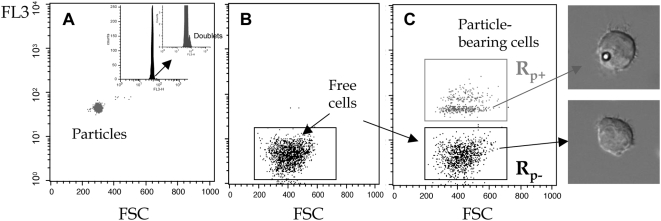
Figure 1. Cell-particle binding detection.
Fluorescence in channel 3 (FL3, >670 nm emission) versus forward scattering dot plots of (A) particles alone, — corresponding histogram shown in insert , (B) cells alone, and (C) cells brought into contact with particles. Particle-bearing cells concentrated at higher fluorescence, gate Rp+ are clearly distinct from free cells, gate Rp−. Optical microscopy images illustrate each gate content.

