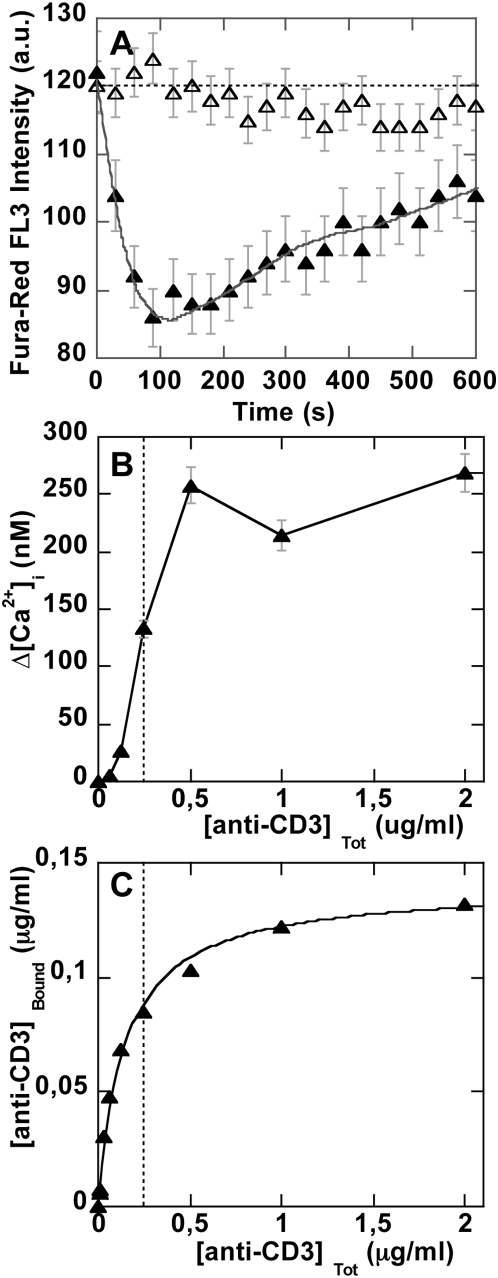
Figure 5. Cell TCR/CD3 occupation and calcium signal triggering by soluble anti-CD3.
T cells (2×10⁶/ml in PBS buffer) loaded with 10 µM Fura-Red calcium probe were treated with increasing concentrations of soluble FITC-anti-CD3 (0.075 to 2 µg/ml) at time t = 0. (A) Time-dependent Fura-Red fluorescence intensity variation is shown for 2 µg/ml (▴) and 0.075 µg/ml (Δ) anti-CD3. (B) The corresponding intracellular calcium changes are reported as a function of anti-CD3 concentration. (C) Anti-CD3-FITC binding curve, obtained simultaneously with mean FL1 fluorescence intensity.

