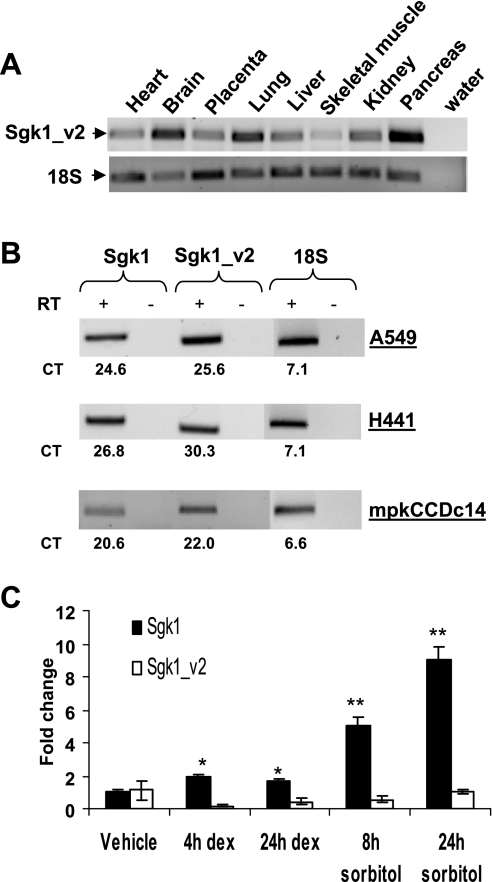
Fig. 2.
RT-PCR for Sgk1_v2 in various tissue and cell lines. A: 5 ng of cDNA from each tissue were used for PCR amplification of Sgk1_v2 and 18S rRNA and amplified products were analyzed by agarose gel electrophoresis. The amplified 562-bp Sgk1_v2 and 138-bp 18S rRNA are shown. B: Sgk1, Sgk1_v2, and 18S rRNA amplified by qRT-PCR from H441, A549 mRNA, and mpkCCDc14 and products were analyzed by agarose gel electrophoresis. Reverse transcriptase (RT) was omitted in control reactions. The threshold cycle (CT) value for each reaction is shown below. CT values are inversely proportional to abundance. C: Sgk1 and Sgk1_v2 amplified by qRT-PCR in A549 cells treated with 100 nM dexamethasone (dex) or 300 mM sorbitol for the indicated times and then corrected for 18S rRNA and expressed as fold-change compared with vehicle. *P < 0.05 compared with vehicle. **P < 0.001 compared with vehicle. Student's t-test (n = 4 ± SE).

