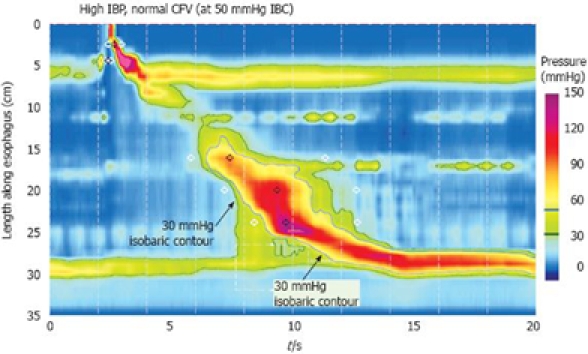
Figure 3.

Defining increased intrabolus pressure using high-resolution manometry. The figure illustrates a swallow with functional obstruction at the EGJ. Note that the 30 mmHg isobaric contour line (black) deviates quickly from the 50 mmHg isobaric contour line (blue). In this case, the contractile front velocity is normal, reflecting the propagation velocity of 50 mmHg isobaric contour rather than the 30 mmHg isobaric contour. The intrabolus pressure domain is defined by the compartmentalized pressurization between the propagating contraction and the EGJ. Modified from: Pandolfino et al[26].
