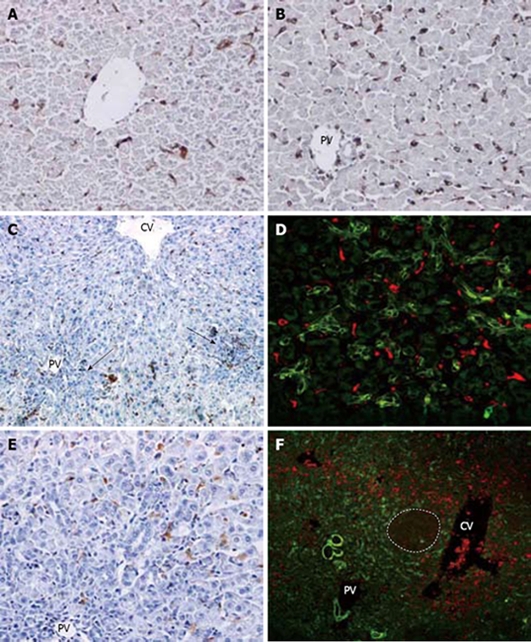
Figure 3.

Kupffer cell response and correlation with oval cells following PH of rats treated with AAF. A: Normal rat liver. Small round or spindle-like cells in the sinusoids are labelled (× 200); B: On day 2 after PH, there is marked increase of ED1 (+) cells in periporal and interlobular sinusoids. No oval cells are seen in the poral areas (× 200); C: on day 4 after PH, number of pericentral and periportal ED1 (+) cells decreased along with the ductular oval cells(arrows) (× 100); D: double immunofluorescent labelling for ov-6 (green) and ED1 (red) at day 4 after PH. A few scattered ED1 (+) cells around the portal appeared to admix with ov-6 (+) oval cell (× 400); E: on day 9 after PH, very few ED1 (+) cells are visualized in the periportal ductular oval cells (× 200); F: double immunofluorescent labelling for ov-6 (green) and ED1 (red) on day 12 after PH. Dash line marks the edge of a regenerative small hepatocyte nodus. ED1 (+) cells are situated around the small hepatocte nodus and ductular ov-6 (+) cells (× 100).
