
Figure 1.
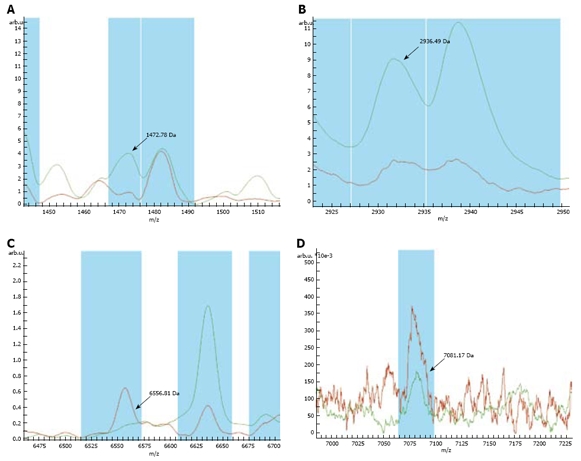
Sample spectrum showing a lower average peak value for proteins 1472.78 Da (A) and 2936.49 Da (B) in the normal group than in the gastric cancer group, and a higher value for proteins 6556.81 Da (C) and 7081.17 Da (D) in the normal group than in the gastric cancer group. Red line: Normal group; Green line: Gastric cancer group.