
Figure 3.
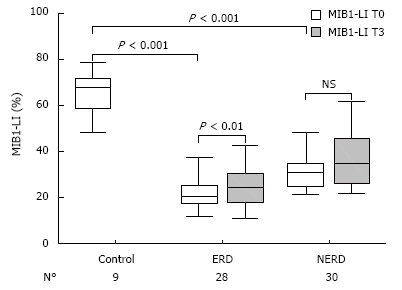
Box plots of MIB1-LI values, LI median (bold line in the box), and interquartile range (upper and lower lines of the box) in human esophageal mucosa of healthy controls and ERD and NERD patients, basal (T0) and after 3 mo of therapy (T3).
Official websites use .gov
A
.gov website belongs to an official
government organization in the United States.
Secure .gov websites use HTTPS
A lock (
) or https:// means you've safely
connected to the .gov website. Share sensitive
information only on official, secure websites.
Box plots of MIB1-LI values, LI median (bold line in the box), and interquartile range (upper and lower lines of the box) in human esophageal mucosa of healthy controls and ERD and NERD patients, basal (T0) and after 3 mo of therapy (T3).