
Fig. 6.
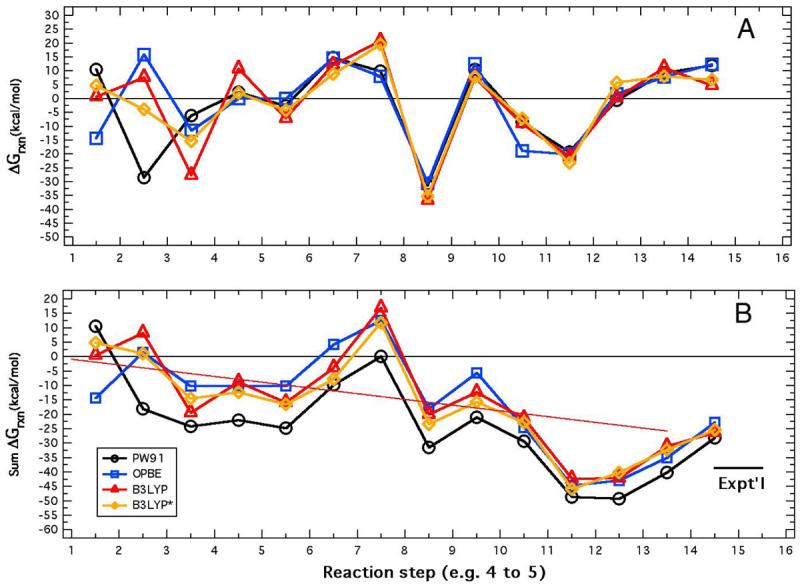
Visual comparison of individual ΔGrxn (A)and ΣΔGrxn (B) values obtained using the four functionals: PW91, OPBE, B3LYP, and B3LYP* taken from Table 4 along a trajectory from 1 to 14 to 1 ending at zero in plot A and ending in the average overall reaction free energy, −26.1 kcal/mol, and comparison with the experimental value of −38.7 kcal/mol (short horizontal line). The sloping line in B is made between 0.00 kcal/mol at state 1 and −26.1 kcal/mol at state 14.