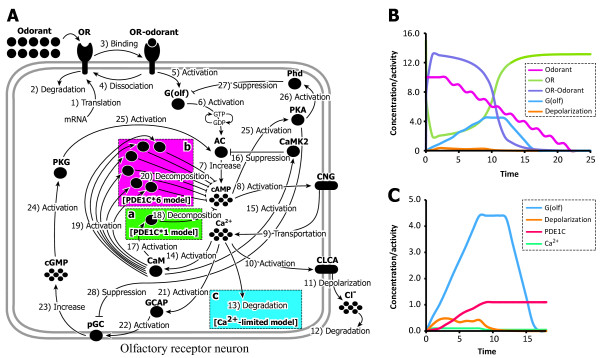
Figure 5.
Schematic view of a simulation model of the olfactory transduction (OT) pathway and its simulation performance. (A) OT simulation model constructed under the KEGG pathway database [31]. (B) Observed resultant oscillations of the odorant, OR, OR-odorant complex, G(olf), and depolarization under the "single-PDE1C [threshold = 1]" model. The x-axis indicates the simulation time scale, and the y-axis indicates the concentration of the odorant and/or activity intensities of involved proteins. (C) Observed oscillations of the G(olf), depolarization, Ca2+, and PDE1C, the latter two are the key molecules of the negative feedback circuit of the OT, which finally blocks the depolarization.

