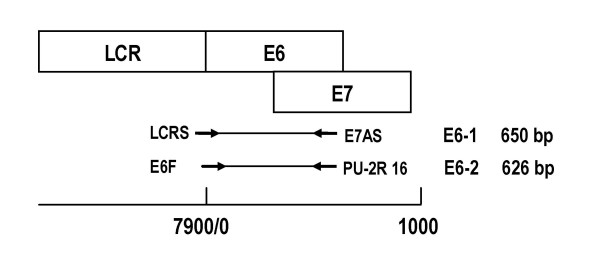
Figure 3.
Direct and nested PCR used to generate E6-1 and E6-2 amplicons. The upper part of the figure is a diagram of the long control region (LCR) and the E6 and E7 genes, whose sequences partially overlap. The middle part describes the E6-1 amplicon of 650 bp generated by direct PCR with the LCRS/E7AS primer pair and the E6-2 amplicon of 626 bp generated by nested PCR with the E6F/PU-2R 16 primer pair. The lower part is a scale to mark the positions of the LCR, E6 and E7 genes and the E6-1 and E6-2 amplicons in the HPV16 genome.

