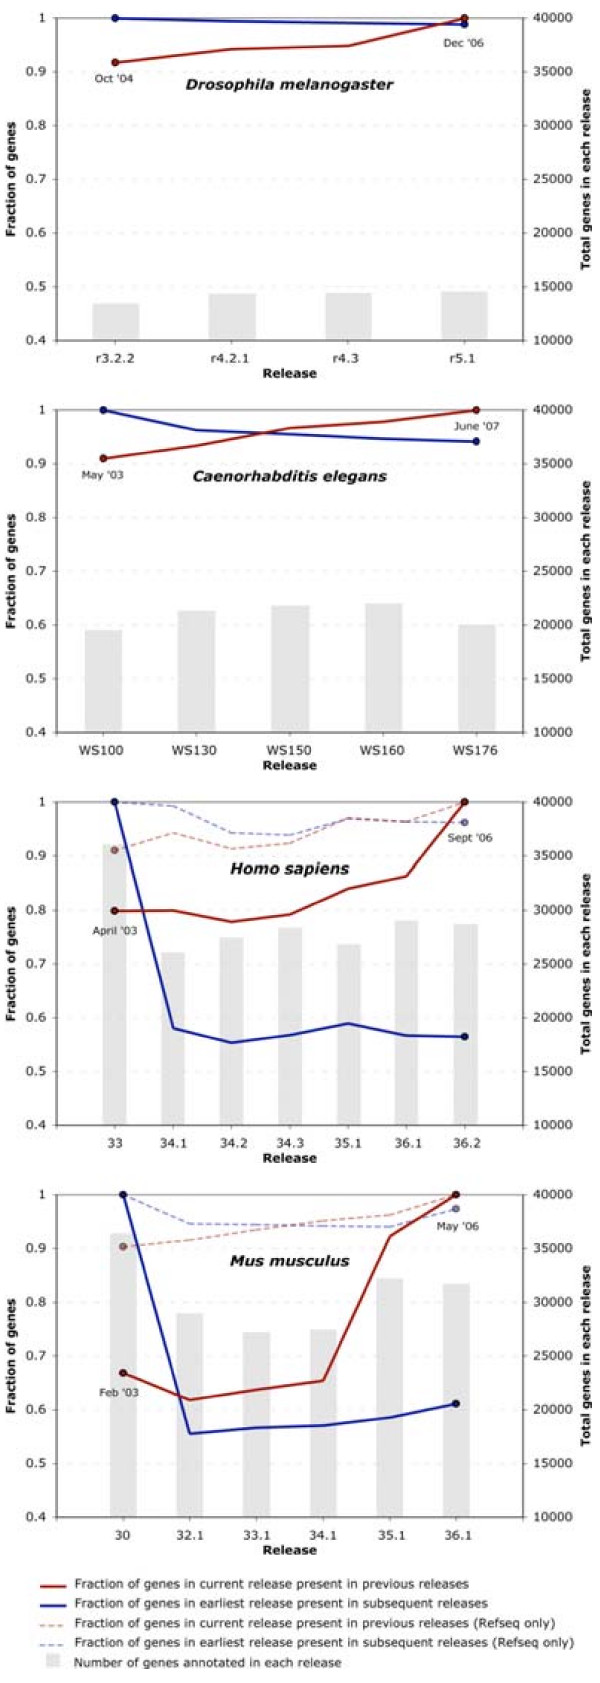
Figure 3.
Annotation Turnover. Gene Annotations traced from the first release forward (blue line) and from the last release backwards (red line). Dotted lines in the H. sapiens and M. musculus panels show the same data plotted for RefSeq NM/NR annotations only. x-axis: release number. y-axis (left-hand side): fraction of genes in the first or last release with reciprocal best hits in subsequent releases. y-axis (right-hand side): total number of genes in that release. Release dates for the first and last release surveyed are noted on the Figure.

