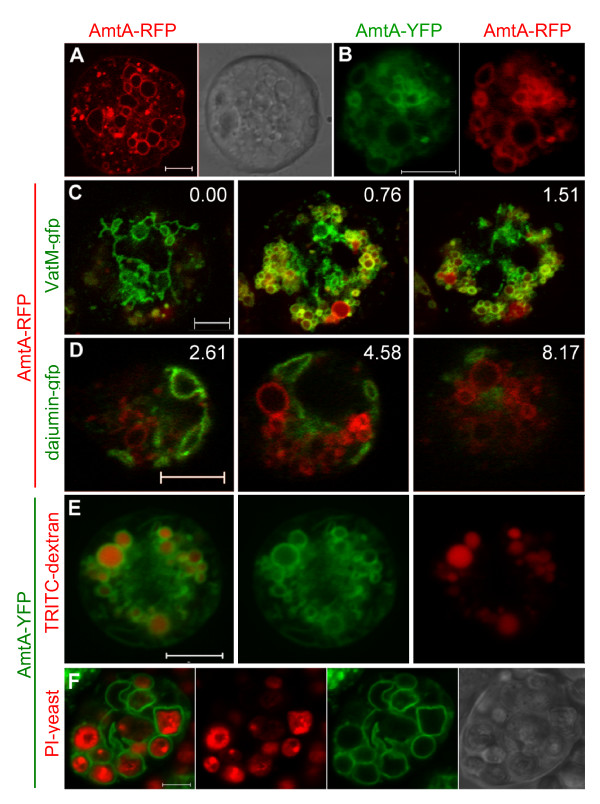
Figure 3.
Localization of AmtA in vegetative cells. (A) Plasma membrane localization in a typical, growing AmtA-RFP cell with corresponding DIC image. (B) Comparison of AmtA-YFP (left) and AmtA-RFP (right) co-expressed in the same cell. (C) Colocalization (yellow) of AmtA-RFP (red) with contractile vacuoles and endolysosomes (green) labeled with VatM-GFP in Ax2-VatM-GFP cells. Three images from a Z-stack; numbers indicate μm distance above the plane of the first photograph (0.00) in the series. (D) Mutually exclusive localization of AmtA-RFP (red) and contractile vacuoles (green) labeled with Dajumin-GFP in Ax2-Dajumin-GFP cells. Three images from a Z-stack, numbers indicate μm distance above the plane of the first photograph in the series. (E) Localization of AmtA-YFP on endolysosome membranes. AmtA-YFP (green) cells were incubated with TRITC-dextran (red) to identify the lumens of endolysosomes. (F) Localization of AmtA-YFP on phagosome membranes and corresponding DIC image. AmtA-YFP (green) cells were incubated with propidium iodide stained yeast (red) to identify the lumens of phagosomes. All images are confocal with 5 μm scale bars.

