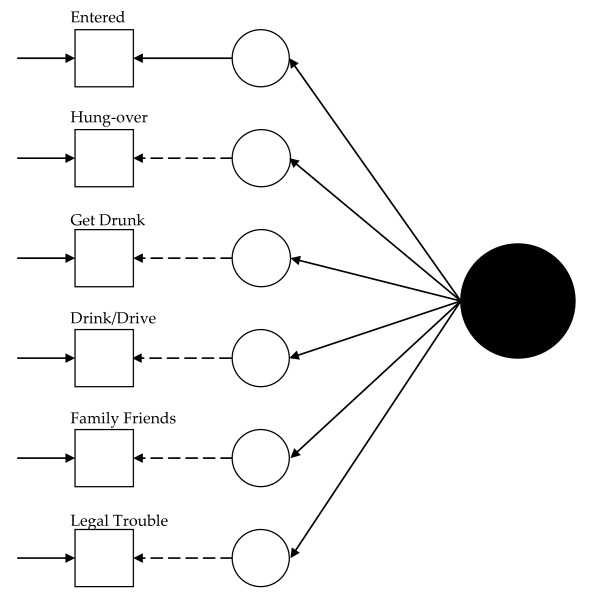
Figure 2.
Path diagram summarizing Model 2, the 1992 alcohol abuse measurement model constraining the loadings to equality across groups. The solid black circle represents the alcohol abuse variable. The small circles represent the continuous latent response variates underlying the dichotomous items (represented by the squares). The arrows from the solid black circle to the smaller circles represent the loadings. The arrows from the small circles to the squares represent the thresholds. The arrows pointing only to the squares represent the uniquenesses. Solid lines represent values constrained to equality across non-Hispanic Caucasians and Hispanics. Dashed lines represent values freely estimated across non-Hispanic Caucasians and Hispanics.

