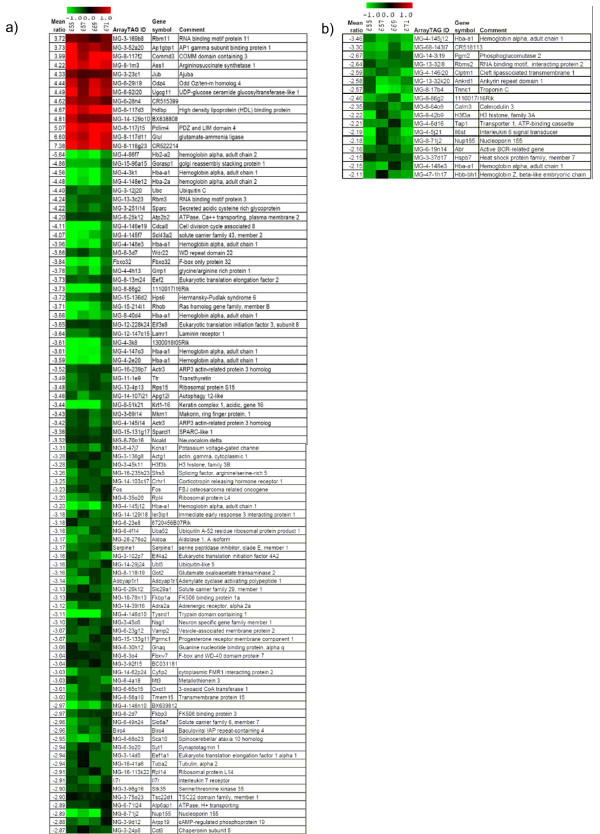
Figure 9.
Heat plots of gene expression profiles from 8 DNA microarray experiments of Eya3 mutants versus control mice. Differential gene expression was analyzed in the brain (a) and in the heart (b). One dye-flip pair represents two experimental replicates of each analyzed mouse (A-D). One ArrayTAG ID is the unique probe identifier from the LION Bioscience clone set. Official gene symbols are given. The scale bar encodes the ratio of the fold induction; 0.7% (a) or 1.3% (b) of the elements are above the upper limit of the color range selection (red is up-regulated and green down-regulated in the Eya3 mutant mice).

