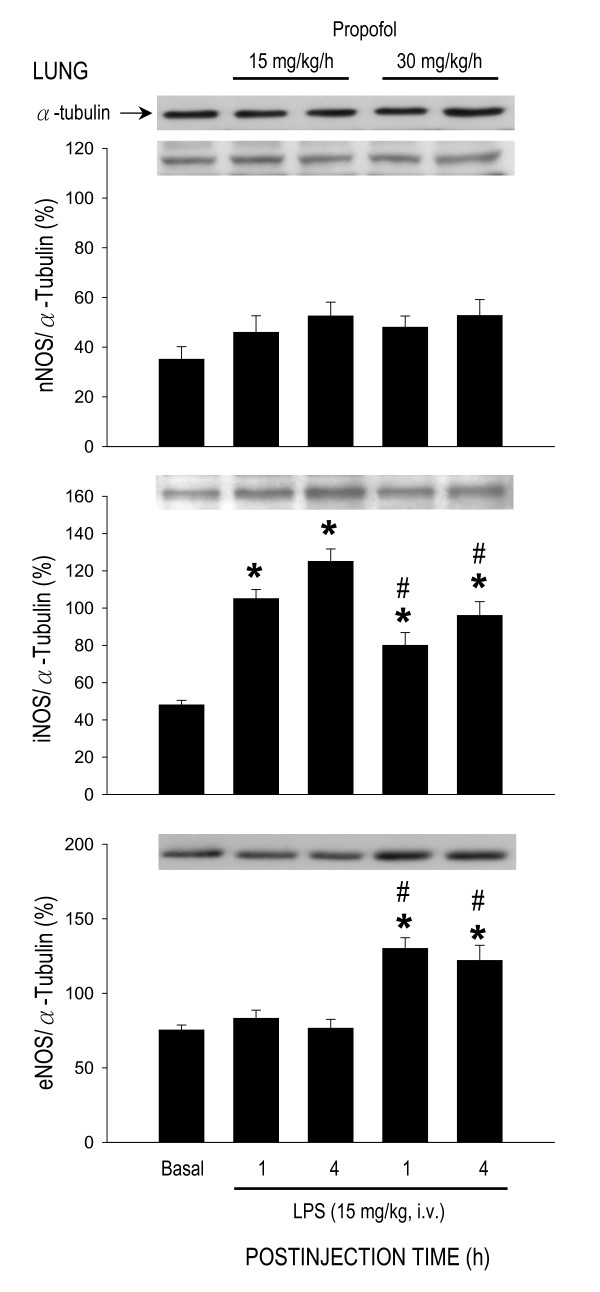
Figure 6.
Representative Western blots of nNOS, iNOS or eNOS (insets) or densitometric analysis in amount of protein relative to α-tubulin from the lung at 1 or 4 h after systemic injection of LPS (15 mg/kg) in rats that were maintained under propofol anesthesia (15 or 30 mg/kg/h). Values are mean ± SEM of quadruplicate analyses of samples from 4 animals per each experimental group. *P < 0.05 vs. basal expression and #P < 0.05 vs. low dose (15 m/kg/h) propofol group at corresponding time points in the Scheffé multiple-range test. Basal indicates expression of nNOS, iNOS or eNOS in the lung of the control groups at 30 min after propofol infusion.

