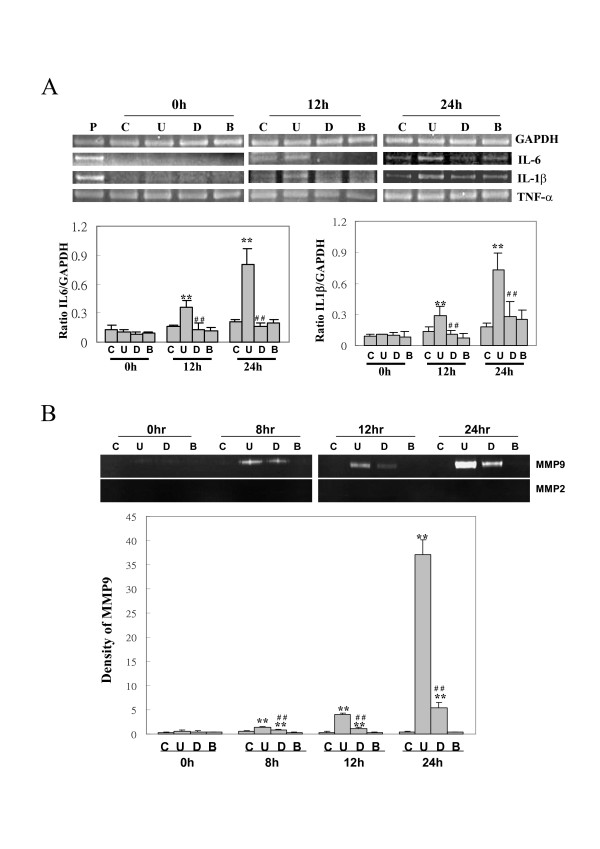
Figure 2.
Messenger RNA expression of various cytokines and MMP enzymatic activity in RAW264.7 cells. (A) A representative agarose gel of RT-PCR for IL-6, IL-1β, and TNF-α. GAPDH is used as internal control. The lower panels are the quantitated results of IL-6 and IL-1β mRNA. (B) The activities of MMP9 and MMP2 were detected by zymographic assays and the quantified results are shown in the lower panels. Similar results were obtained in three independent experiments. C, U, D, B indicates experimental groups of control, B19-VP1u, B19VP1uD175A, and bvPLA2. ** and ## indicate significant differences as compared to the control or the VP1u group, respectively.

