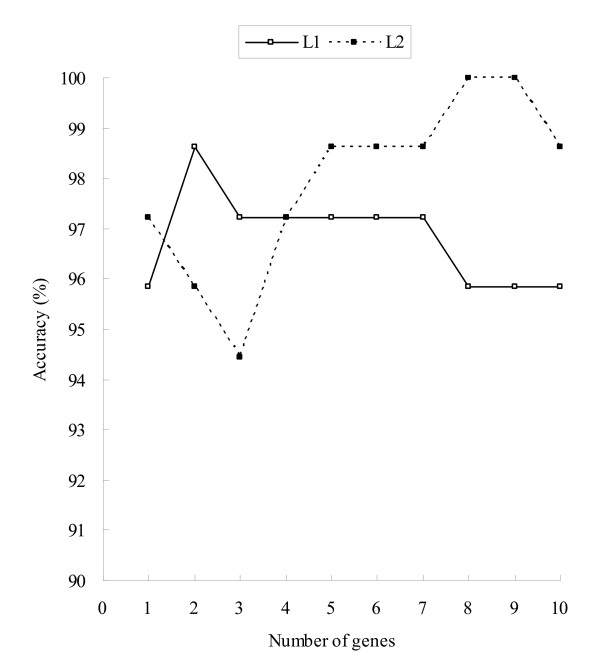
Figure 3.
Prediction performance of X-AI along with different number of genes on the test set of two datasets. The y-axis represents classification accuracy and the x-axis is the corresponding number of genes which were used as information in classification. L1: for the dataset of Golub et al. [1] L2: for the dataset of Armstrong et al. [20]

