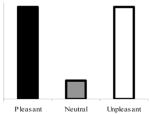
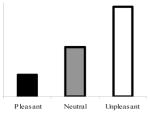
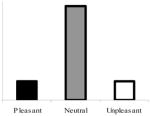
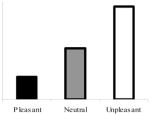
Table 1.
Predicted Affective Startle Modulation Patterns in the Nondepressed Group, Planned Interaction Tests, and Predicted Group Effects for Each Probe Condition
| Probe condition | Predicted startle patterns in the nondepressed group | Planned trend test | Predictions |
|---|---|---|---|
| 2,000-ms anticipatorya |

|
Group × Quadratic Trend | Significant group interaction; significant quadratic trend in the nondepressed group only |
| 750-ms anticipatoryb (exploratory) |

|
Group × Linear Trend | Significant group interaction; significant linear trend in the nondepressed group only |
| 300-ms viewingc |

|
Group × Quadratic Trend | No group interaction; significant quadratic trends in both groups |
| 3,500–4,500-ms viewingd |

|
Group × Linear Trend | Significant group interaction; significant linear trend in the nondepressed group only |
Note. Bar graphs are idealized and meant for illustrative purposes; they do not reflect possible amplitude differences between probe categories. Consistent with an emotion-context insensitivity model of depression (Rottenberg, 2005, 2007), patterns of startle responding in the depressed group were predicted to be attenuated, relative to the nondepressed control group, across the three levels of the valence factor in all probe conditions.
