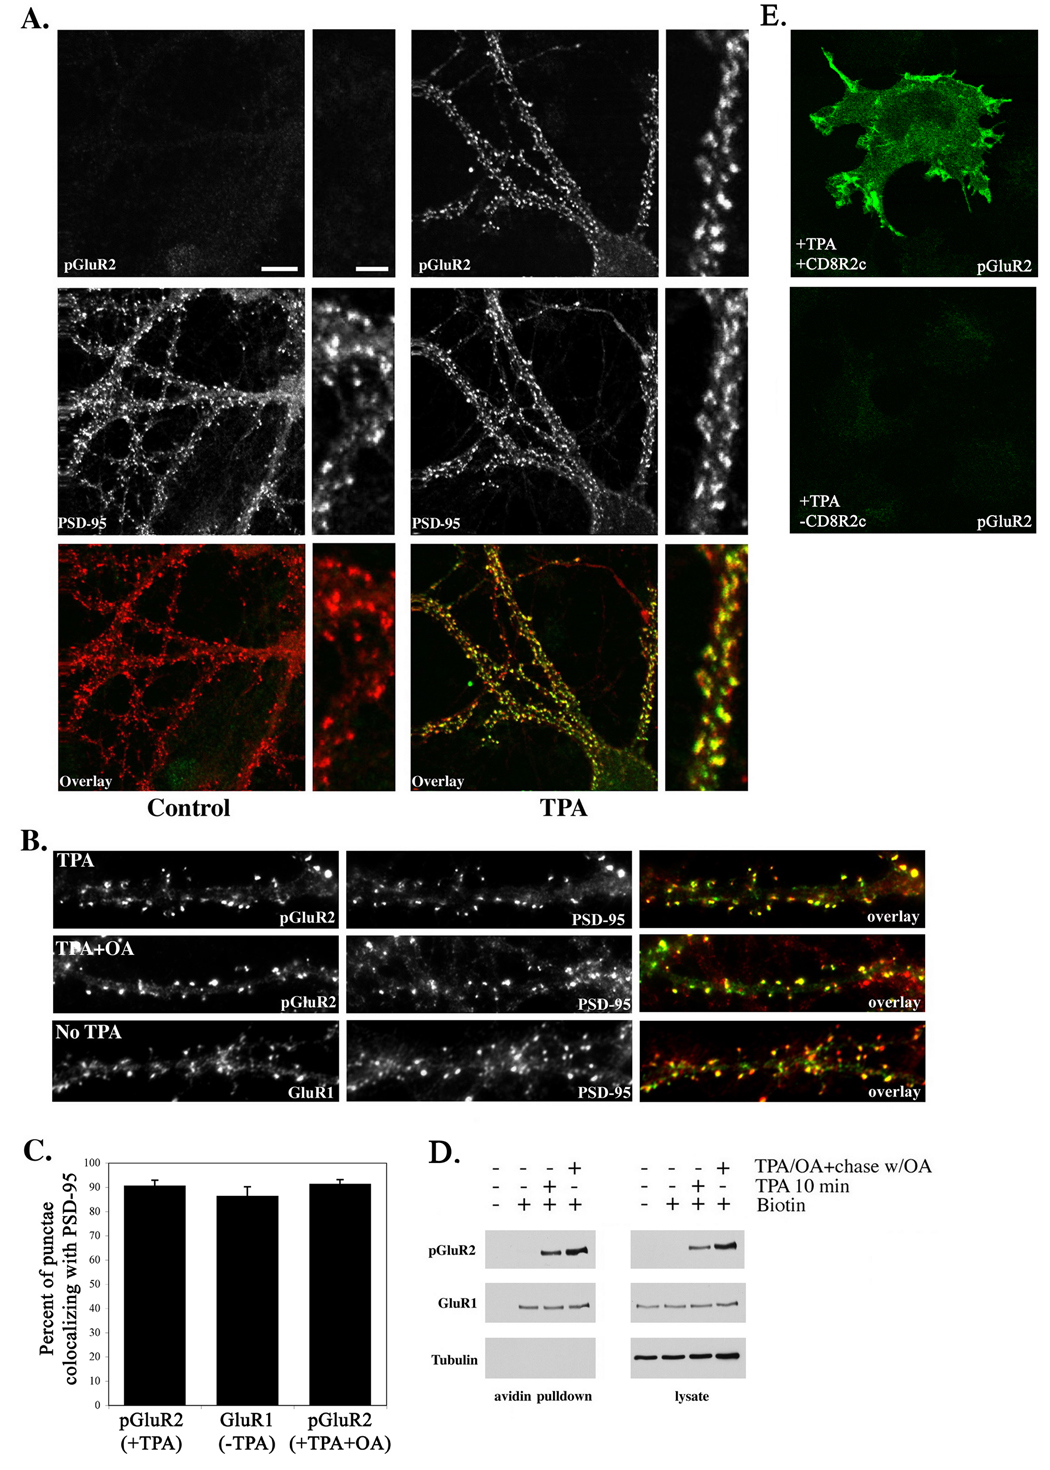
Figure 1. Stable synaptic retention of AMPARs following phosphorylation of S880 of GluR2.
(A) Antibodies which specifically detect the phosphorylated form of GluR2 (phosphoserine 880) were used to determine the localization of endogenous phosphorylated GluR2 (green) following treatment of cultured hippocampal neurons with TPA (100ng/ml) for 10 minutes (right panels). Cells were counterstained with antibodies to PSD-95 (red) to label excitatory synapses. Untreated controls are shown at left. Phospho-serine 880 was not detected in the absence of TPA treatment (left panels). Treatment with TPA revealed a strong increase in phosphorylated GluR2 (A, right). Both groups in A were scanned under identical gain settings with a confocal microscope. Phosphorylated GluR2 demonstrated strong colocalization with PSD-95 which did not differ from that of GluR1 in untreated controls (see text and C for values). (B) Inhibition of PP1 with okadaic acid for 10 minutes prior to and during TPA administration did not significantly alter pGluR2/PSD-95 colocalization or the synaptic localization of AMPARs (see text and C for values). Colocalization of GluR1 (green) with PSD-95 (red) in the absence of TPA was similar to that of pGluR2 (green) and PSD-95 (red) following TPA administration (see text and C for values). (C) Histogram depicting the percentage of GluR1 or pGluR2 punctae which colocalized with PSD-95 punctae (mean±SEM). (D) Pull down of biotinylated endogenous cell surface proteins after the indicated treatments confirmed the presence of phosphorylated GluR2 on the cell surface as long as 20 minutes (the longest chase period examined) after the 10 minute TPA treatment. ‘Chase’ denotes incubation of neurons in okadaic acid for 20 minutes following removal of TPA. Densitometric values indicating the amount of surface GluR1 from two independent experiments were as follows (represented as percentage of controls not treated with TPA): TPA=97, 110; TPA/OA+chase w/OA=129, 103. Scales bar in A, large panel=10µm, bar in small panel=3µm. (E) Representative controls demonstrating the specificity of pS880 antibodies for the phosphorylated form of GluR2. Top, COS cells transfected with CD8R2c, a chimeric protein containing the GluR2 C-terminus (see methods), treated with TPA, and labeled with pS880 antibodies. Bottom, untransfected COS cells treated with TPA and labeled with pS880 antibodies.

