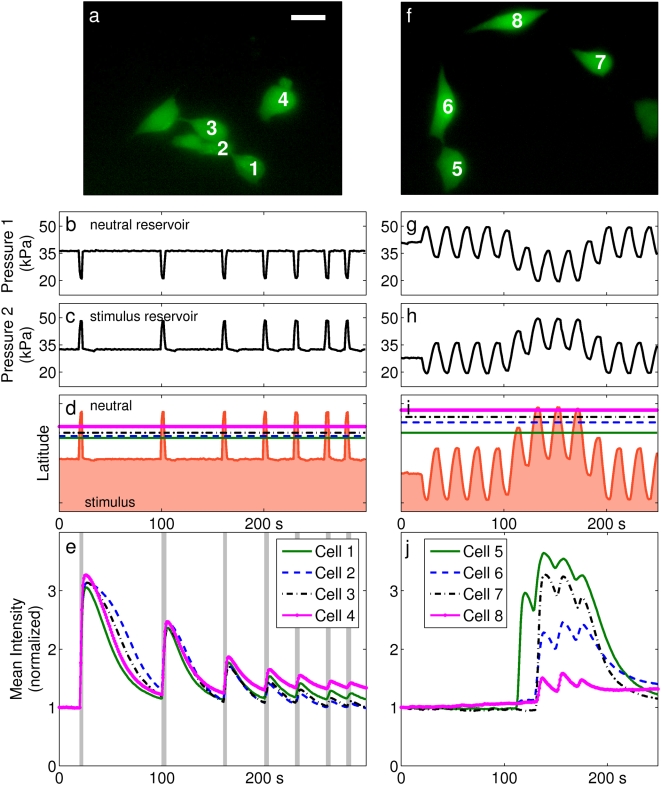
Figure 2. Cellular responses to stimulus.
Two different clusters of cells were loaded with Fluo-4 AM and exposed to ionomycin through modulation of interface position. (a,f) Fluorescent micrographs showing the cells under observation. Scale bar is 25 µm. (b,g) Measurements of static pressure in the reservoir containing the neutral stream. (c,h) Pressure measurements from the reservoir containing the stimulus stream. (d,i) An estimate of interface position across the width of the channel as a function of time as determined from pressure measurements. Units are dimensionless latitude. The horizontal lines indicate the centroids of the regions of interest labeled in (a,f). (e,j) Mean fluorescent intensity over each region of interest vs. time, normalized to the initial value. Vertical shading in (e) indicates periods when cells were predicted to be under maximal exposure. Data from (f–j) are shown in Supplementary Video S2.

