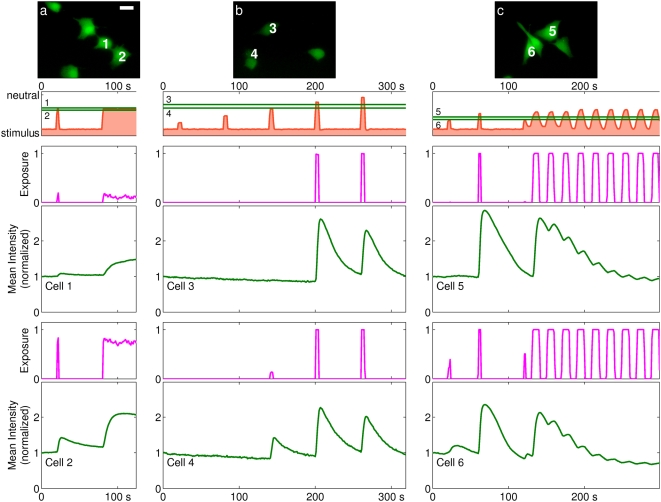
Figure 4. The responses of cells to different exposure signals.
Each column of plots presents similar information to Fig. 3 with error regions omitted. Scale bar is 25 µm. (a) Two cells differentially exposed to a short pulse followed by a step-change in exposure. Because of their different latitudes, Cell 1 experiences a sub-maximal exposure, while Cell 2 experiences a near-maximal exposure. (b) Pulses of gradually increasing latitude; see also Supplementary Video S1. (c) Cells exposed to a short pulse followed by periodic stimulation.

