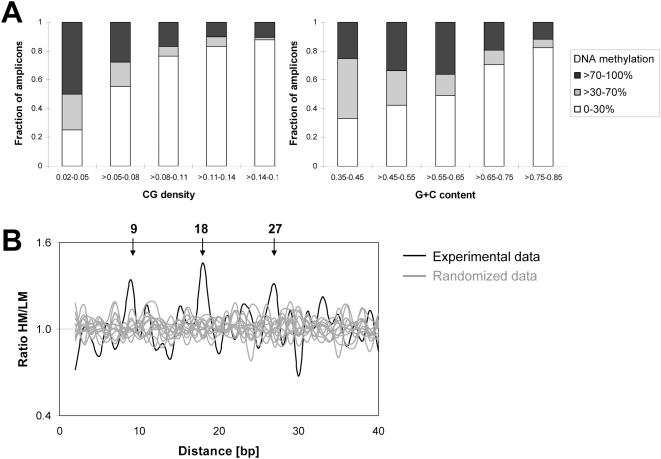
Figure 4. Correlation of DNA methylation and DNA sequence properties.
(A) Association of DNA methylation with low CpG density and GC content. (B) Overrepresentation of distances between CpG sites in the sequences of highly methylated DNA as compared to low methylated. The occurrences of all distances of CpG sites were counted in highly methylated (HM) amplicons and low methylated (LM) amplicons. Then, the ratio of both numbers (HM/LM) was plotted versus the distance in bps (shown in black). The same calculation was performed 12 times with randomized methylation level of all amplicons (shown in light gray). The simulations were used to derive the p-value of the overrepresentation of the peaks at 9 bps (p-value <2.0×10⁻⁵), 18 bps (p-value <1.5×10⁻⁸) and 27 bps (p-value <1.1×10⁻⁴).

