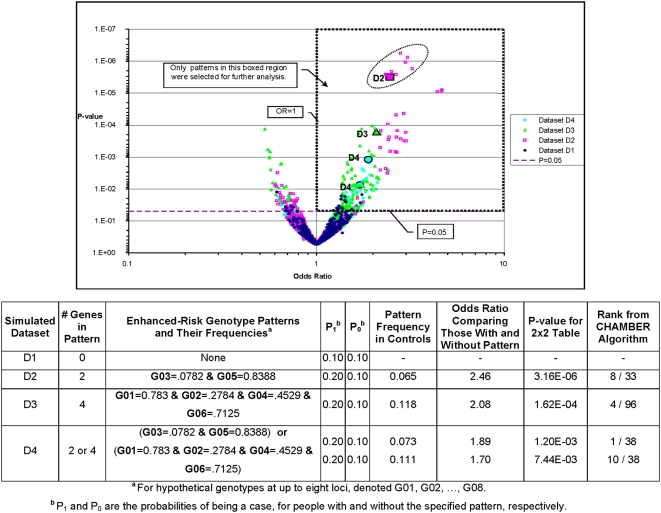
Figure 2. Distribution of P-values and Odds Ratios for Four Simulated Datasets.
Designated patterns in D2–D4 are shown as large filled glyphs. Dataset D1 was modeled to have no factors that confer risk of being a case vs. a control. Datasets D2 and D3 contain a 2-gene and a 4-gene risk pattern respectively. Dataset D4 simulated the situation of etiologic heterogeneity in which disease risk was conferred by different patterns in different subsamples. The list of all discovered patterns was filtered to include only those with support>5% of cases, odds ratio>1, and P-value<0.05. P-value was used as the FOM. Note that adding even a single high risk genotype (D2, D3) results in many patterns above the noise level (D1).

