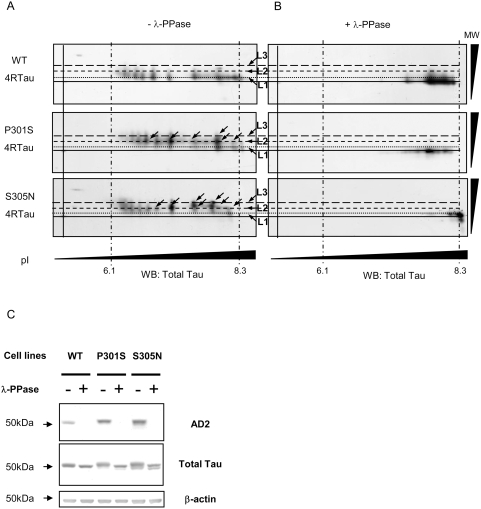
Figure 2. Analysis of Tau phosphorylation in 4RTau cell lines by 2D electrophoresis.
A) Bi-dimensional analysis of WT and Mutated P301S or S305N 4RTau. Differentiated cells treated with tetracycline for 48 hours were subjected to 2D analysis and immunoblotted with Tau Exon10 antibody (4RTau specific). Alignments of immunoblots were performed using unspecific products revealed by secondary antibody. Different molecular weight (MW) levels (levels1–3: L1–L3) of Tau isovariants are represented by short dashed lines and pI indicators (obtained with an internal IEF control) by long and short mixed dashed lines. B) Bi-dimensional analysis of WT and Mutated 4RTau after in vitro Tau dephosphorylation followed by immunoblotting with Tau exon10 antibody. C) Immunoblot analysis of in vitro dephosphorylated WT and mutated (P301S and S305N) 4RTau. Differentiated cells treated with tetracycline for 48 hours were subjected (+) or not (−), to an in vitro dephosphorylation by λ-phosphatase and immunoblotted by phosphorylation dependent antibody. Total amount of Tau proteins loaded is visualized with TauCter 1902 antibody (Total Tau) and β-actin was used as loading control.

