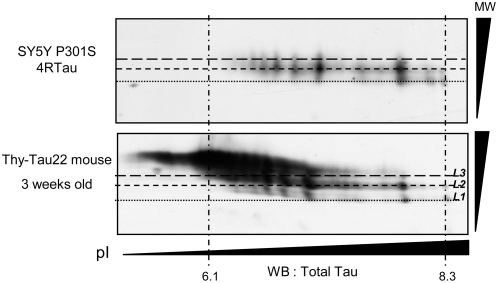
Figure 3. Analysis of overall Tau phosphorylation in THY-Tau 22 transgenic mice.
Comparison of 2D analysis of human exogenous Tau in 3-weeks old Thy-Tau22 trangenic mice and mutated P301S 4RTau from SY5Y Cells. Alignments of immunoblots were performed using unspecific products revealed by secondary antibody. Different molecular weight (MW) levels (L1–L3) of Tau isovariants are represented by short dashed lines and pI indicators (obtained with an internal IEF control) by long and short mixed dashed lines. Exogenous Tau in mice was probed by an anti-human Tau antibody and exogenous P301S 4RTau in SY5Y cells was visualized by Tau-Exon10 antibody.

