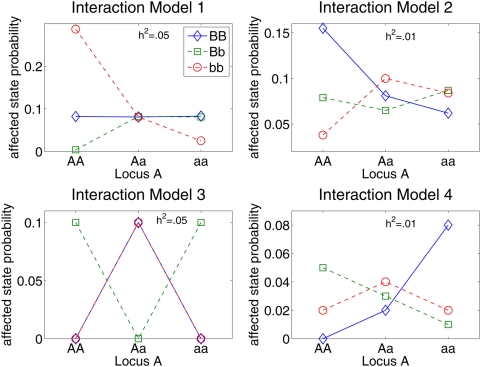
Figure 1. Penetrance diagram for genetic models used to compare strategies for filtering SNPs from case-control data.
All four genetic models involve two interacting loci. Each point in a diagram is the probability of an individual being in the affected phenotype state for the given genotype combination. Model 3 is the purely epistatic XOR model, which displays no independent effects. The other interaction models display a small main effect through locus B. The models in the left column have .05 heritability and the models in the right column have .01 heritability. Analysis results for these simulated models are given in Figure 2.

