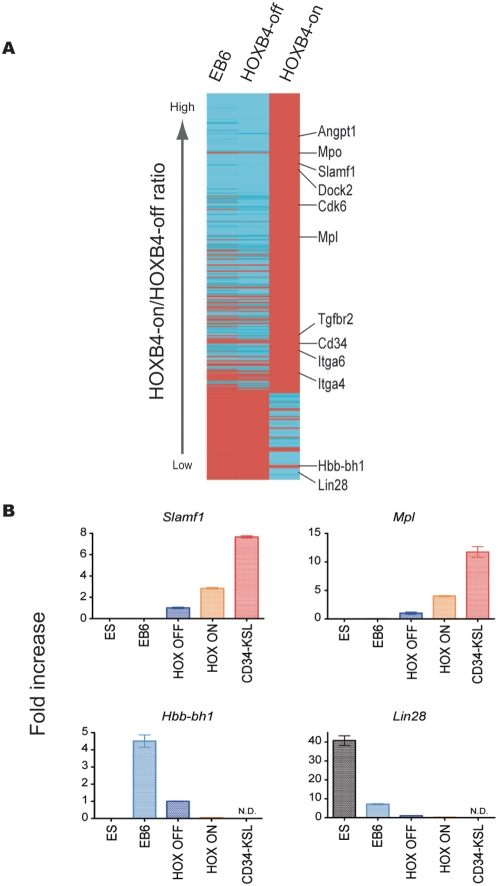
Figure 5. Heat map of differentially expressed genes.
(A) Microarray analysis was performed on cDNAs from c-Kit+CD41+ EB6 cells without HOXB4 expression, c-Kit+CD41+ cells after co-culture without HOXB4 expression, and c-Kit+CD41+ cells after co-culture with HOXB4 expression. The finally selected 223 genes are shown in this graph (for selection criteria, see Legend, Table S3). Red indicates genes up-regulated 5-fold or more. Blue indicates genes down-regulated 5-fold or more. (B) Real-time PCR was performed on normalized cDNA from the cells described above, from ESCs maintained without HOXB4 expression, and from CD34−KSL cells from adult bone marrow. The mean plus or minus 1SD (n = 3) is shown for 4 representative genes.

