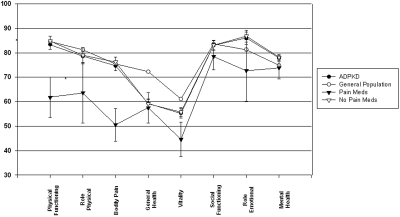
Figure 2.
Comparison of the mean individual scales of health of the SF-36 questionnaire between the COHORT and the general population and between the pain medication groups. The first four scales on the x axis generate the PCS score, and the last four scales on the x axis generate the MCS score. *Statistically significant differences (P < 0.01) in the physical function and bodily pain indexes were found between those taking and not taking pain medications.

