Figure 2.
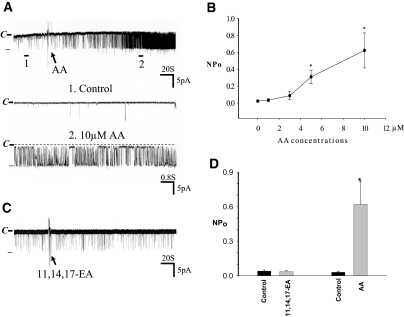
(A) A channel recording showing the effect of AA on BK channels in the CCD. The experiments were performed in a cell-attached patch, and the holding potential was 0 mV. The channel closed level is indicated by C and a dotted line. The top trace shows the time course of the experiment, and two parts of the recording indicated by numbers and a bar are extended to show the fast time resolution. (B). A dose-response curve of AA effect on BK channels. Each point represents a mean value from five to six patches. (C) A recording showing the effect of 10 μM 11,14,17-EA on BK channels in the CCD. (D) The effect of 10 μM 11,14,17-EA and AA on BK channel activity. The experiments were performed in cell-attached patches of the CCD from rats on a HK diet. *Significant difference (P < 0.05). The pipette solution was composed of 140 mM KCl, 1.8 mM MgCl2, and 5 mM HEPES (pH 7.4).

