Figure 3.
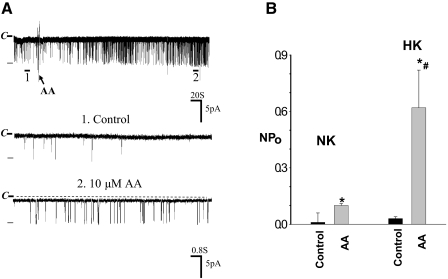
(A) A channel recording showing the effect of 10 μM AA on BK channels in the CCD from rats on NK diet. The top trace is the time course of the experiment, and two parts of the recording indicated by numbers are extended to show the fast time resolution. The channel closed level is indicated by C, and the holding potential was 0 mV. An arrow indicates the addition of AA. (B) A bar graph summarizes the effect of AA on BK channels in the CCD from rats on NK or HK diet, respectively. *Significant difference between AA and corresponding control group; #significance between HK and NK groups.

