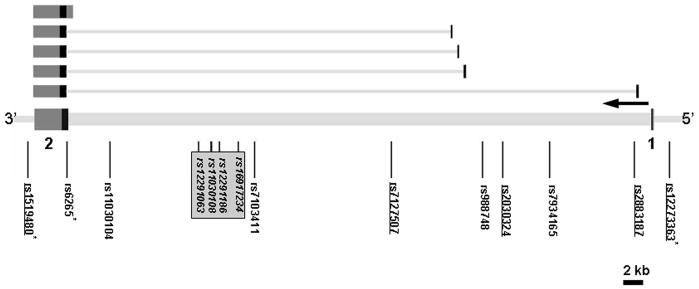
Figure 1. BDNF gene structure and SNP location.
The BDNF gene structure is drawn based on the transcript NM_170731 (encoding isoform b), with five alternative forms shown above: NM_170732 (isoform a), NM_170733 (isoform a), NM_001709 (isoform a), NM_170734 (isoform c), NM_170735 (isoform a), in order from bottom to top; other splicing forms have also been reported. SNP positions are shown below. Exons are numbered and indicated in black, the untranslated regions in dark gray and introns as light gray bars connecting the 2 exons. The direction of transcription of all isoforms is right to left, as indicated by the horizontal arrow. The SNPs which demonstrated significant association with bipolar disorder are underlined. The SNPs showing evolutionary conservation are indicated by asterisks. Four SNPs showing nominal significance (p < 0.05) in recent GWAS studies are in italics and boxed (Personal communication with Dr. Francis McMahon; Baum et al., 2007; The Wellcome Trust Case Control Consortium, 2007). The size of the gene is scaled by a 2 kb bar at lower right.

