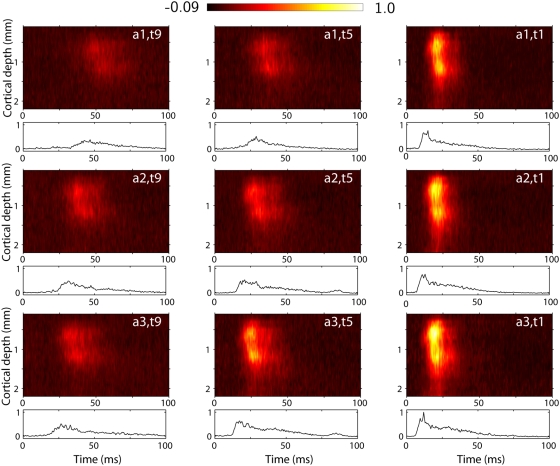
Figure 1. Example experimental data.
Trial-averaged experimental data for experiment 1 for 9 out of 27 applied stimulus conditions for three different amplitudes (rows) and three different rise times (columns). Contour plots show depth profile of MUA as recorded by the laminar electrode, normalized to its largest value over the 22 electrode traces and 27 stimulus condition. Line plots below show the corresponding thalamic MUA recorded by a single electrode, normalized to the largest value over the 27 stimulus conditions.

