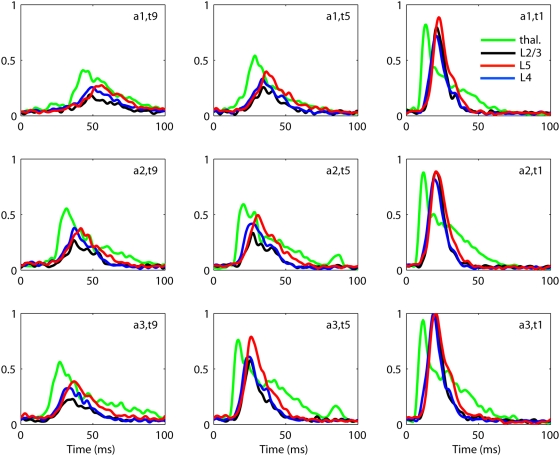
Figure 2. Example extracted population firing rates.
Extracted population firing rates for experiment 1 for 9 out of 27
applied stimulus conditions. Green: thalamus. Black: layer 2/3. Blue:
layer 4. Red: layer 5. Note that the extracted firing rates are
normalized so that the maximum response over all stimulus conditions is
unity. For layer 2/3, layer 4 and layer 5 this occurs for the stimulus  shown in the figure. For the thalamic rate it occurs
for stimulus
  , not shown in the figure.

