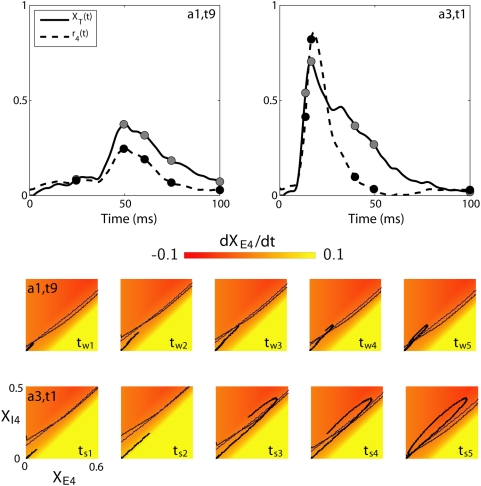
Figure 5. Phase-plane analysis of recurrent thalamocortical model for experiment 1.
Phase-plane analysis of recurrent thalamocortical model in Eqs.
(4–5) for fitted model parameters for experiment 1, cf.
Table 1.
Upper panels show the synaptic drive from thalamus  and the firing rate
  for the weakest (
 ; left) and strongest (
 ; right) stimuli. The filled dots in the two upper
panels show the points in time,
  for
for  and
and  for
for  at which the network states are shown in the two
lower panels. In each of the phase plots (five for each of the
stimuli) the instantaneous excitatory (black) and
inhibitory (blue) nullclines are shown, i.e., the nullclines
obtained with a constant thalamic synaptic drive equal to the
instantaneous value
  for
for  and
and  for
for  . The network's activity is indicated by
the black response curve, where the head of the curve marks the
network's current state, and the tail represents prior
states.

