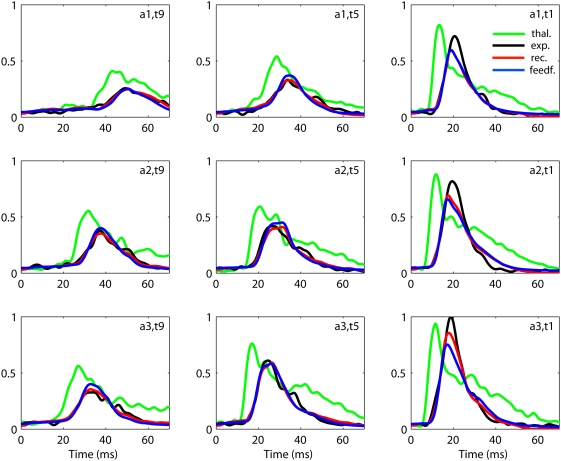
Figure 7. Comparison of thalamocortical model fits.
Comparison of fits of the recurrent and feedforward thalamocortical
models with experimental data set 1 for the same 9 (of 27) stimulus
conditions considered in Fig. 2. The green line corresponds to the thalamic input
firing rate  , the black line to the experimentally extracted
layer-4 firing rate
  , while the red and blue lines correspond to the best
fits of the recurrent (Eq. 2) and feedforward (Eq. 8) models for the
layer-4 firing rate
  , respectively. Time zero corresponds to stimulus
onset.

