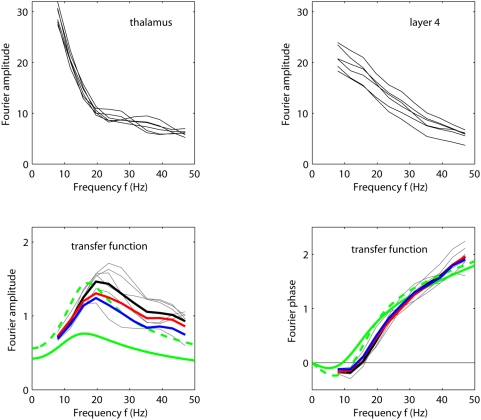
Figure 9. Thalamocortical transfer for experiment 1.
Frequency content, i.e., Fourier amplitudes, of the thalamic input  (upper left) and the layer-4 firing rate
  (upper right) for six stimulus conditions
providing the strongest response in experiment 1 (
 ;
;  ;
;  ;
;  ;
;  ;
;  ). (Note that
  .) The corresponding amplitude (lower left) and
phase (lower right) of the experimental transfer ratio
  are shown as thin grey lines while the thick black
lines represent the corresponding averages for these six stimuli.
Examples of model predictions for amplitude (lower left) and phase
(lower right) of the recurrent thalamocortical transfer-function
model (Eq. 9) are shown for the fitted parameter values
  and
and  for experiment 1 taken from Table 1; green lines correspond
to choosing
  , and dashed green lines to
  . The red and blue lines in the lower panels
correspond to the average of the amplitude (lower left) and phase
(lower right) of the transfer ratios found for the six stimuli
listed above when driving the fitted recurrent (red) and feedforward
(blue) models in Eqs. (2) and (8), respectively, with the
experimentally extracted thalamic input
  .
.

